US And Global Market Internals


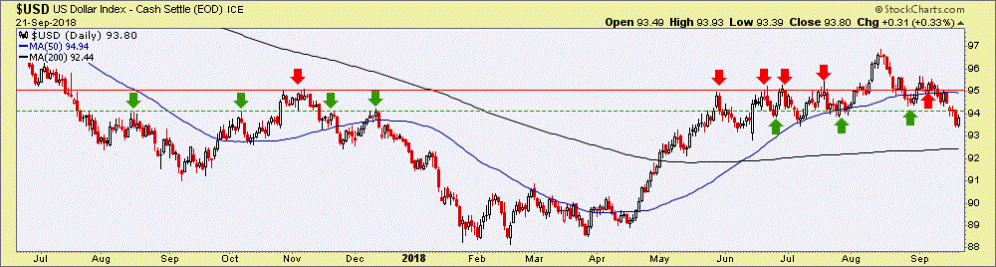
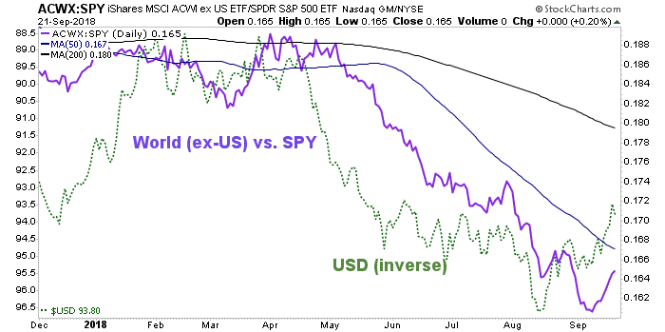
Last week we introduced Uncle Buck as an ‘internal’ and boy, did he not disappoint. USD dropped through the 94 area support and closed the week that way, despite a bounce on Friday. If the breakdown is not a whipsaw, our initial target is the 200 day moving average (currently 92.44) and the expectation would be for the global asset rally to continue. If it’s a head fake, it would likely be back to bearish for the global macro. As it stands now, USD is breaking down and markets are bouncing.
Let’s skip the charts and color code the internals again this week (blue: neutral, red: negative, green: positive)…
- NDX new highs/lows was very weak while SPX is still firm S/T. Both of them are on negative divergences from the January highs.
- Semi Equipment stocks are still in breakdown mode vs. broad Semi, which is still a negative divergence to Tech.
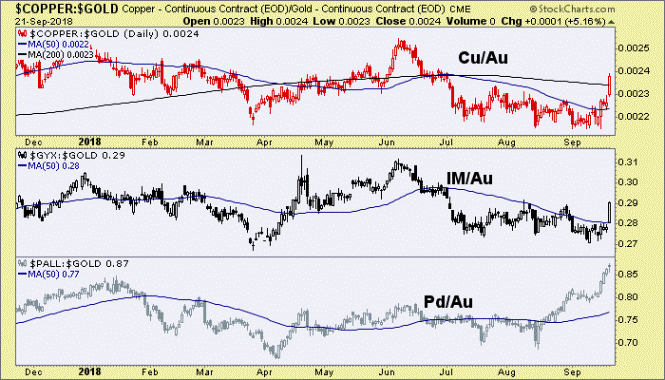
- Industrial Metals have spiked vs. gold and Palladium has confirmed its bullish move vs. gold. This one demands a chart and Palladium tilts this indicator green.
- What do you know? The divergence of the Transports to the Dow was a good one. Maybe Dow Theory only doesn’t work when it is making negative divergences.
- Participation by the average S&P 500 stock is still weak. i.e. the headliners are doing the heavy lifting.
- Junk bonds are at nominal new highs and Junk to Treasury and Investment Grade bonds are still positive. Risk is ‘on’ in the US.
- Inflation expectations broke upward last week as the US dollar broke down. The ‘anti-USD’ trade is after all, a global ‘inflation trade’.
- Last week: “Russell 2000/S&P 500 ratio is still trapped below the SMA 50, just like the USD. It is a potential negative for the USD and positive for the global macro. We’ll call it neutral until USD chooses a direction.”
- RUT/SPX broke down and so did the US dollar.
- US Yield Curve continues to flatten and as such the economic boom is still on. But the YC did bounce above its 50 day average; so this should be watched near-term.
- SPX/Gold ratio is still very positive and bullish. It is also at significant risk, which rides right along with the extreme bullish backdrop. SPX/Gold took a new leg up, which increases the bullishness and increases the risk.
- Growth (IGX) vs. Value (IVX) continues to be very elevated, risk ‘on’ and bullish. But a daily chart shows consolidation and this too should be watched.
- SPX Advance/Decline remains in line with SPX. No negative divergence.
- The ‘man in the middle’ (the median stock) has not yet made a new high above the January high and closed last week still below S/T resistance.
- The KBE/SPY ratio is negatively diverging the recent rise in 10yr yields as a sector that would be expected to lead in an inflationary, rising interest rate environment fails to do so. Another one to be watched closely.
- On related notes, LIBOR is rising as it has been since 2016. We have not talked much about it in recent years because it has been affected by both monetary and now fiscal (tax) policy and does not appear to be a sound indicator at the moment. But it is rising and traditionally a rising LIBOR is a financial warning sign as inter-bank rates rise.
- On the other hand LIBOR’s running mate, the TED spread, is in decline and supportive as default risk is not a perceived issue among banks right now.
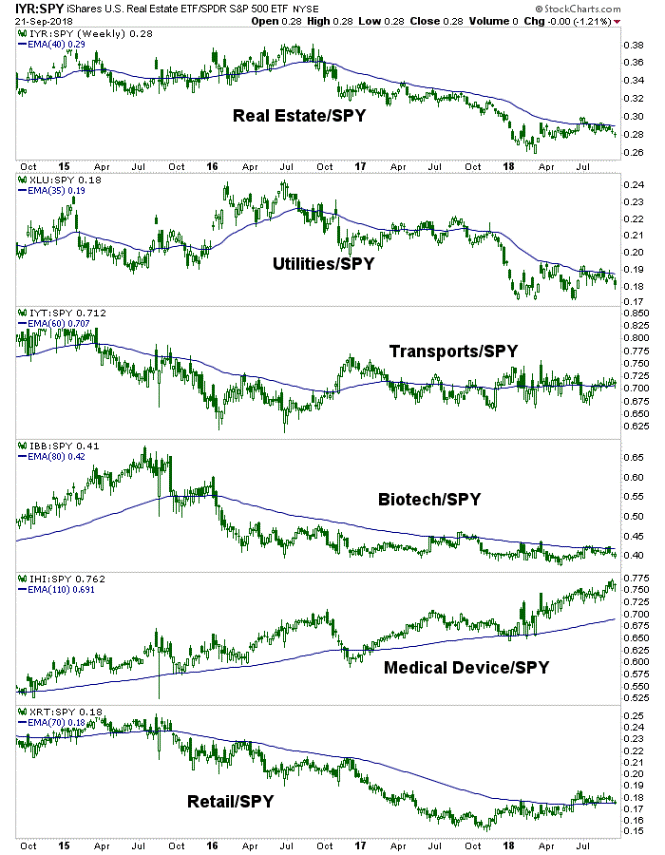
Here is the picture of who is leading the larger trends in US market internals. It remains Tech, even as an analyst heavily promoted as a Technology & Gold expert (by my observation he is anything but) guides bearish on Twitter (as usual). Only Tech maintains a firm leadership trend (although a daily chart would show that trend to be somewhat vulnerable) despite recent strength in both H/C & Industrials.

The best looking – and most overbought – leadership trend remains Medical Devices, same as it has been for years now. Everything else is trending down long-term except for the sideways Transports. Retail/SPY has risen for nearly a year and is testing its leadership now as it tries to change its trend to up.
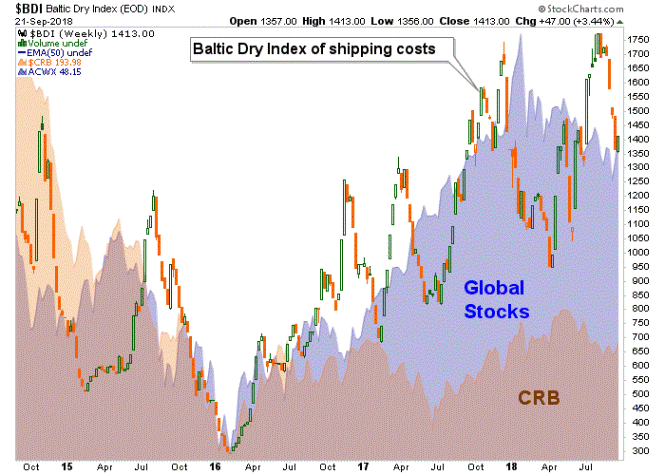
Globally, the BDI bounced a bit last week with global markets and commodities. Logical.
The play was that if the USD drops, the World would pop. And so it was. The World’s downtrend is intact however, and Inverse USD is a little peppy (i.e. USD a bit oversold short-term), so I would not discount the possibility of a S/T pullback in the global trade (rise in USD). It’s why I took a couple of profits on Friday per the Trade Log.
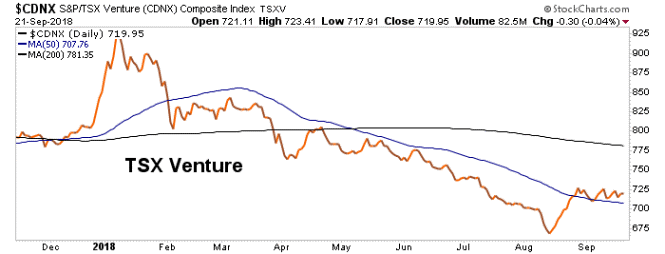
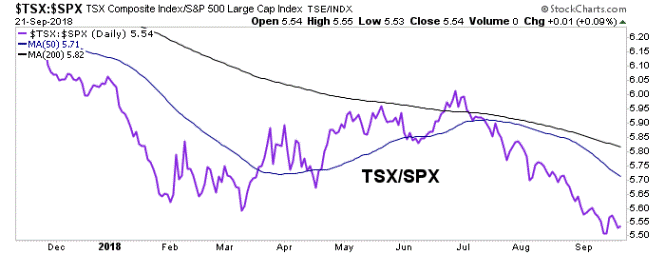
CDNX appears to have been a good forward-looker to last week’s USD pullback and global bounce.
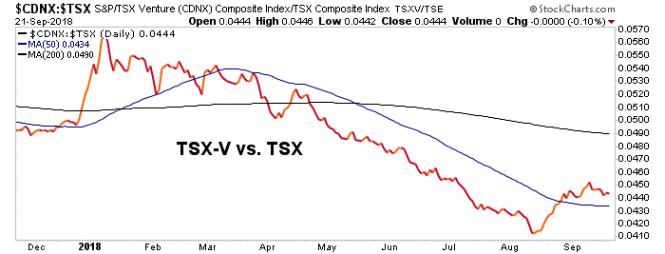
It’s ratio to the TSX is also still fairly constructive.
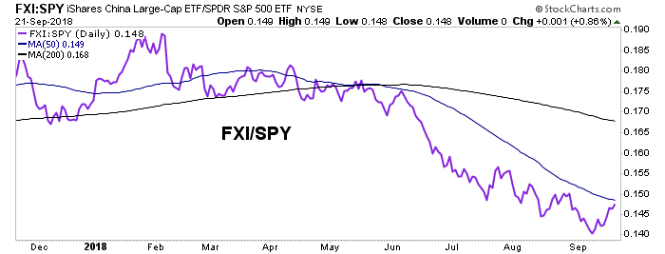
China Large Caps benefited as the Trade War anxiety was so… last summer. I bought and took a profit on FXI. Still hold items like FANUY, SINA and EWY for Asian global exposure.
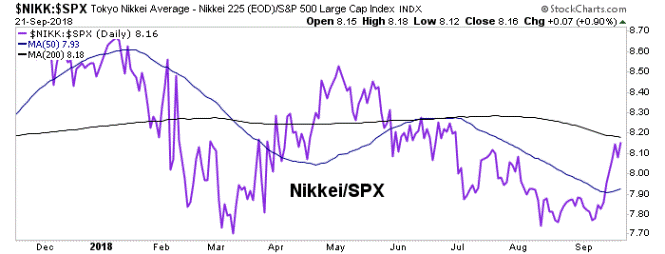
Speaking of Fanuc, the Nikkei rammed upward in a bullish nominal move to get back on (sideways) trend vs. the US.
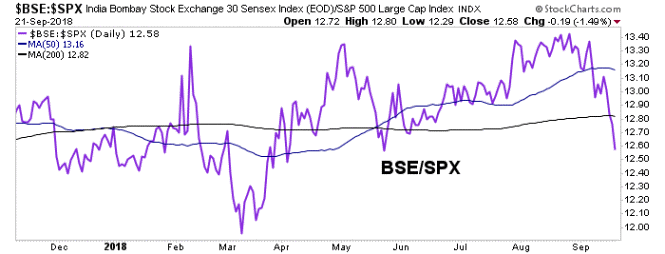
Relative India seems to favor a strong dollar. BSE/SPX rose all through the USD’s rally and got harpooned last week as Uncle Buck dropped.
Relative Canada continues to go nowhere and that makes sense because this ratio had been dependant upon a devaluing currency. CAD rose last week.
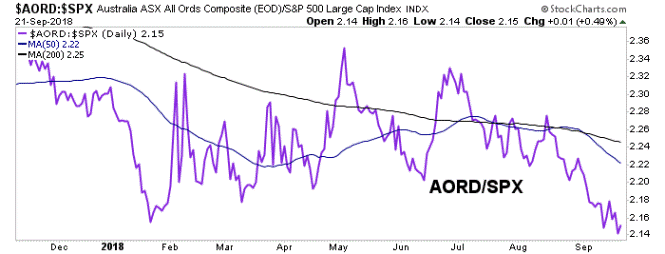
Australia/US is a similar story as the AUD got a big spike (within its 2018 downtrend).
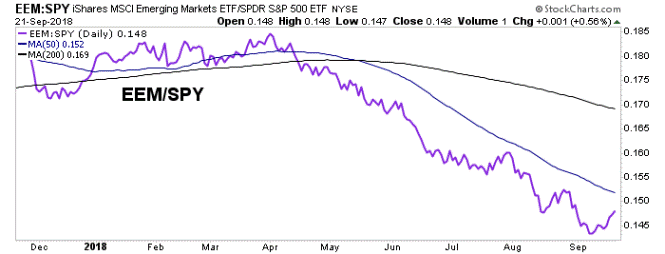
EM/US did the logical thing and bounced (a bit) with the weak USD.
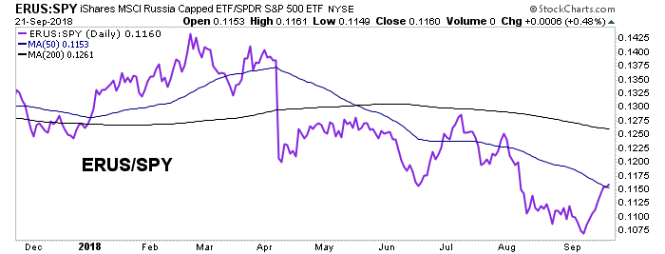
Relative Russia bounced hard within a downtrend.
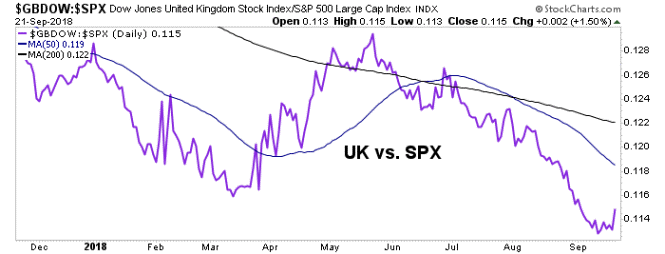
UK/US is much like Canada and Australia, with a recently strong currency and weak stock market. The big bounce was on Friday when not coincidentally the GBP/USD got harpooned.
Finally, a look at the LatAm 40 vs. SPY. A bounce within a downtrend in line with much of the emerging world.
The US & Global Market Internals segment follows the US stock Market segment and leads into the Global Stock Markets segment. To me, this segment, though not glamorous, flashy or fun (like the stock charts in the NFTRH+ Charts & Notes segment for example), feels like the rudder that keeps the ship on the right course, week after week. It’s where key macro signals tend to crop up.
Subscribe to NFTRH Premium (monthly at USD $33.50 or a 14% discounted yearly at USD $345.00) for an in-depth weekly market report, interim market updates and NFTRH+ chart and trade setup ideas, all archived/posted at the site and delivered to your inbox.
You can also keep up to date with plenty of actionable public content at NFTRH.com by using the email form on the right sidebar and get even more by joining our free eLetter. Or follow via Twitter @BiiwiiNFTRH, StockTwits or RSS. Also check out the quality market writers at Biiwii.com.
More from Silver Phoenix 500


